About
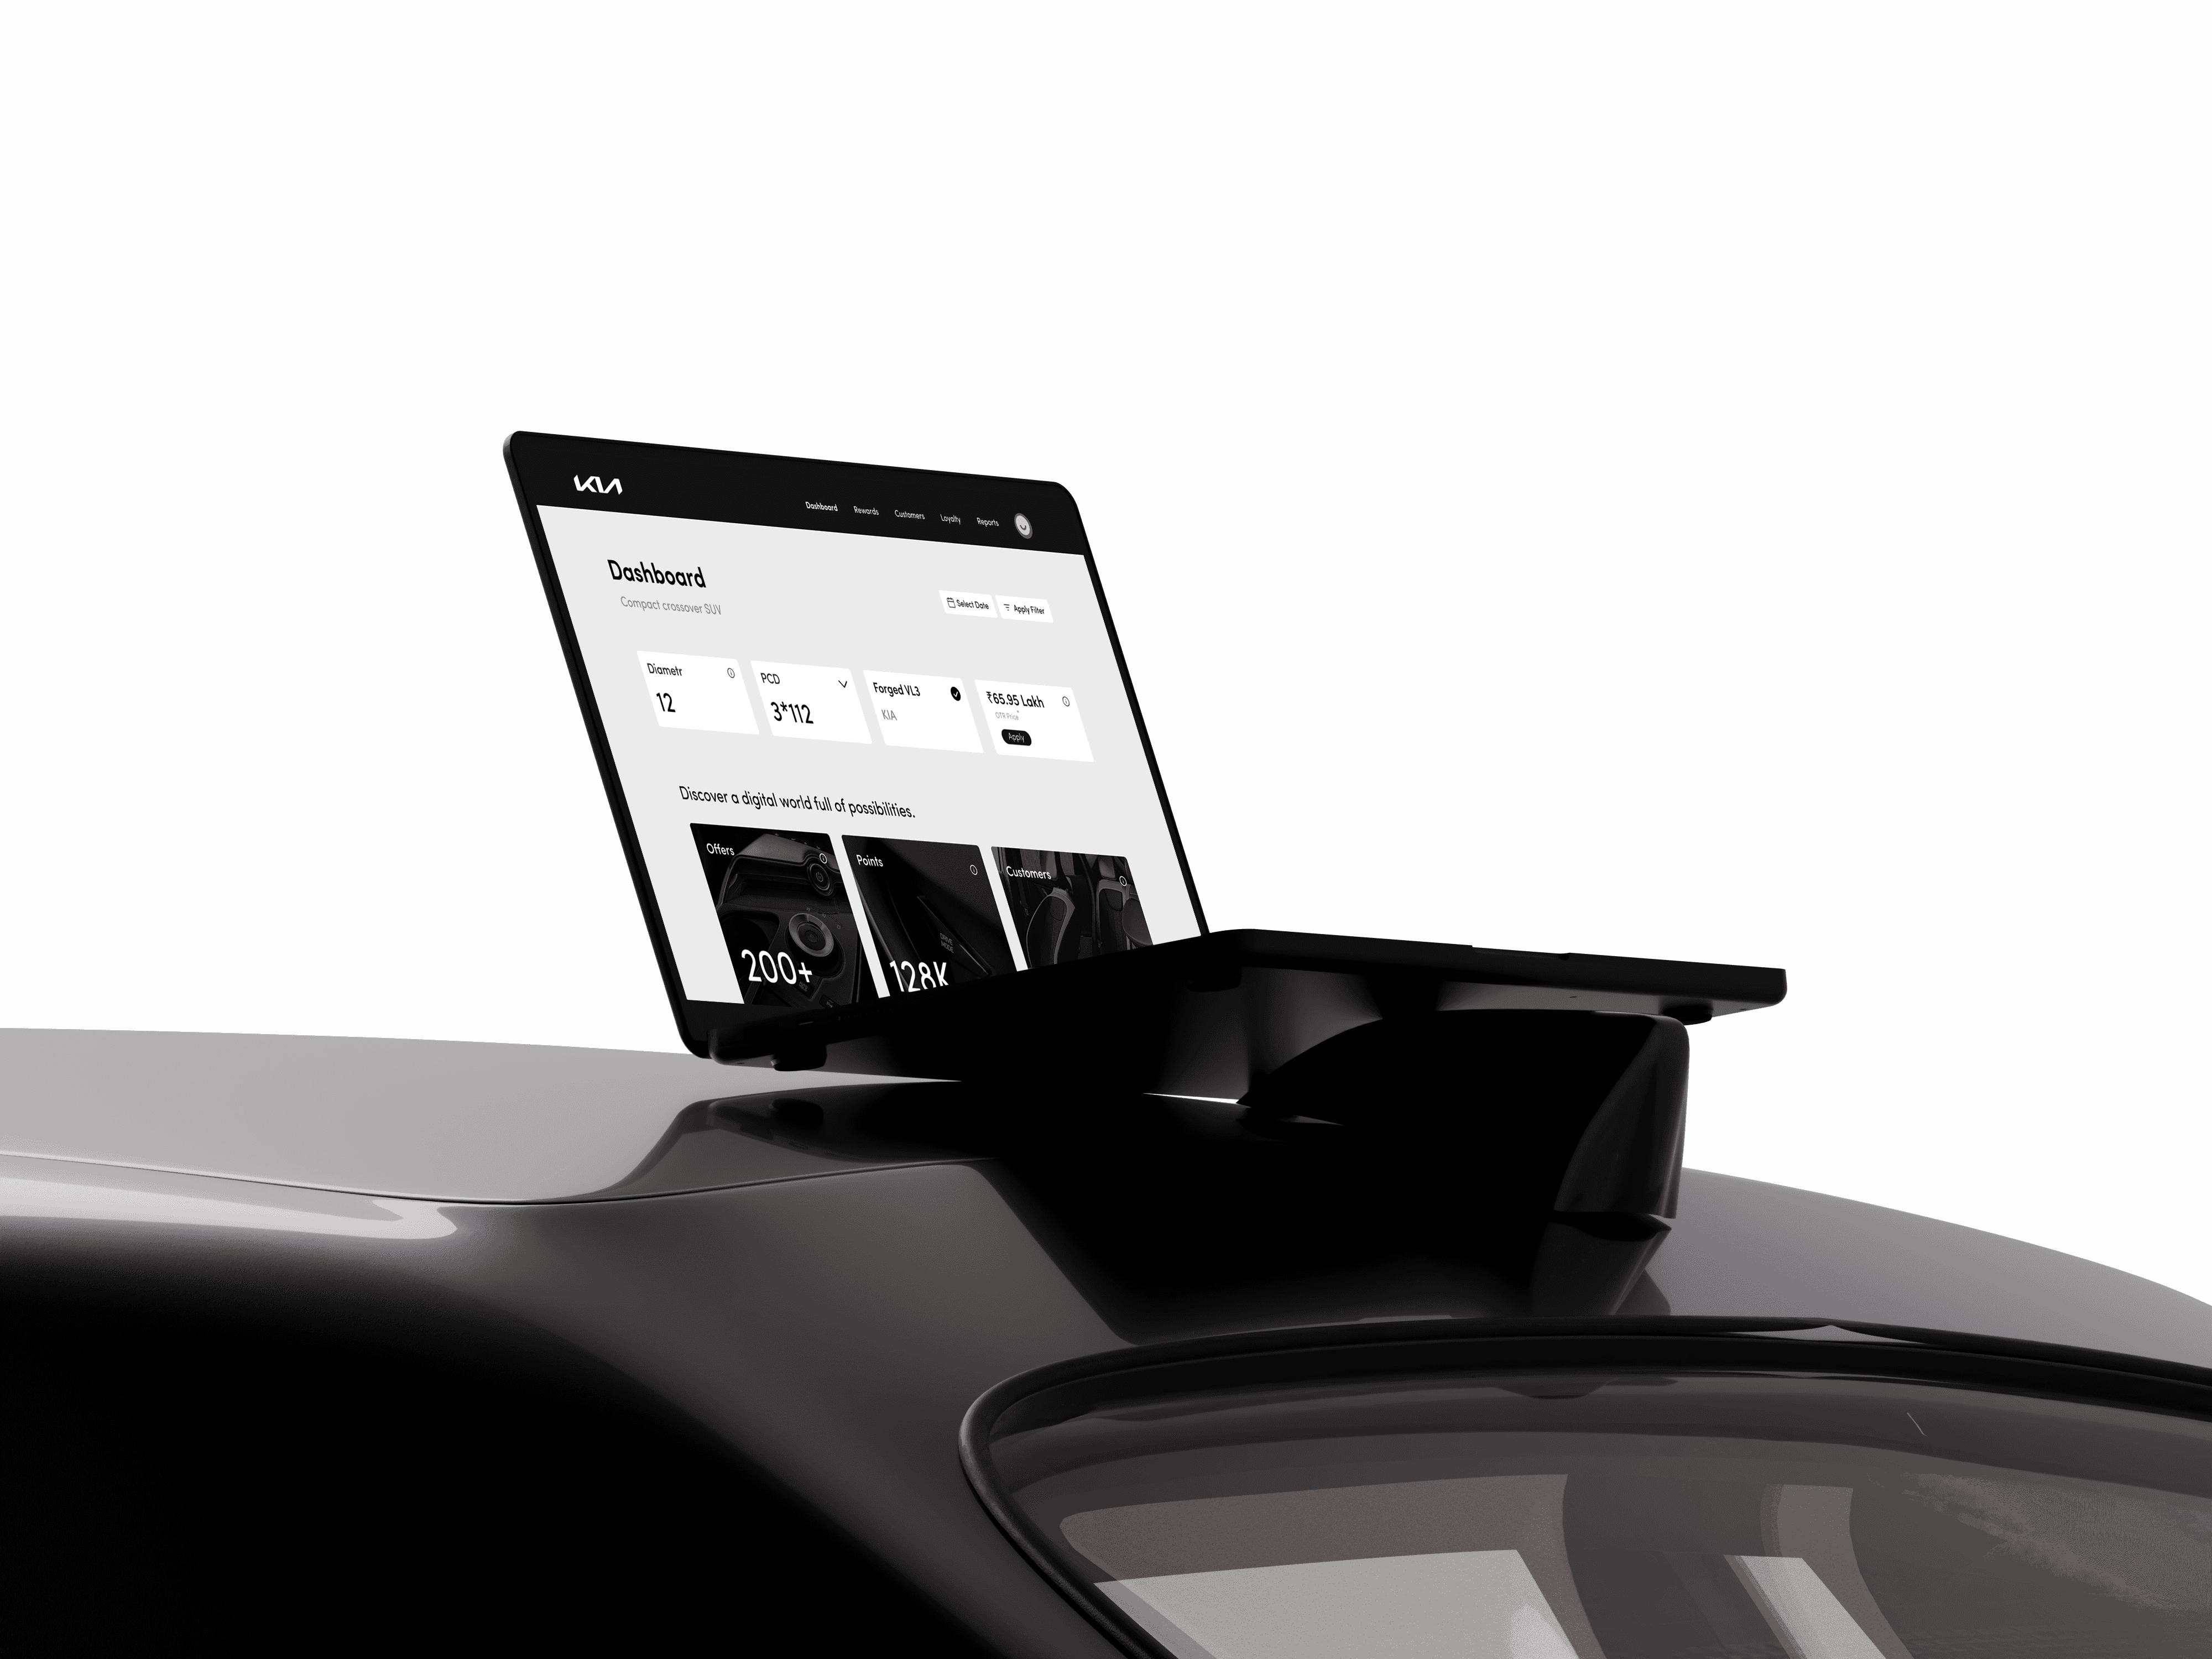
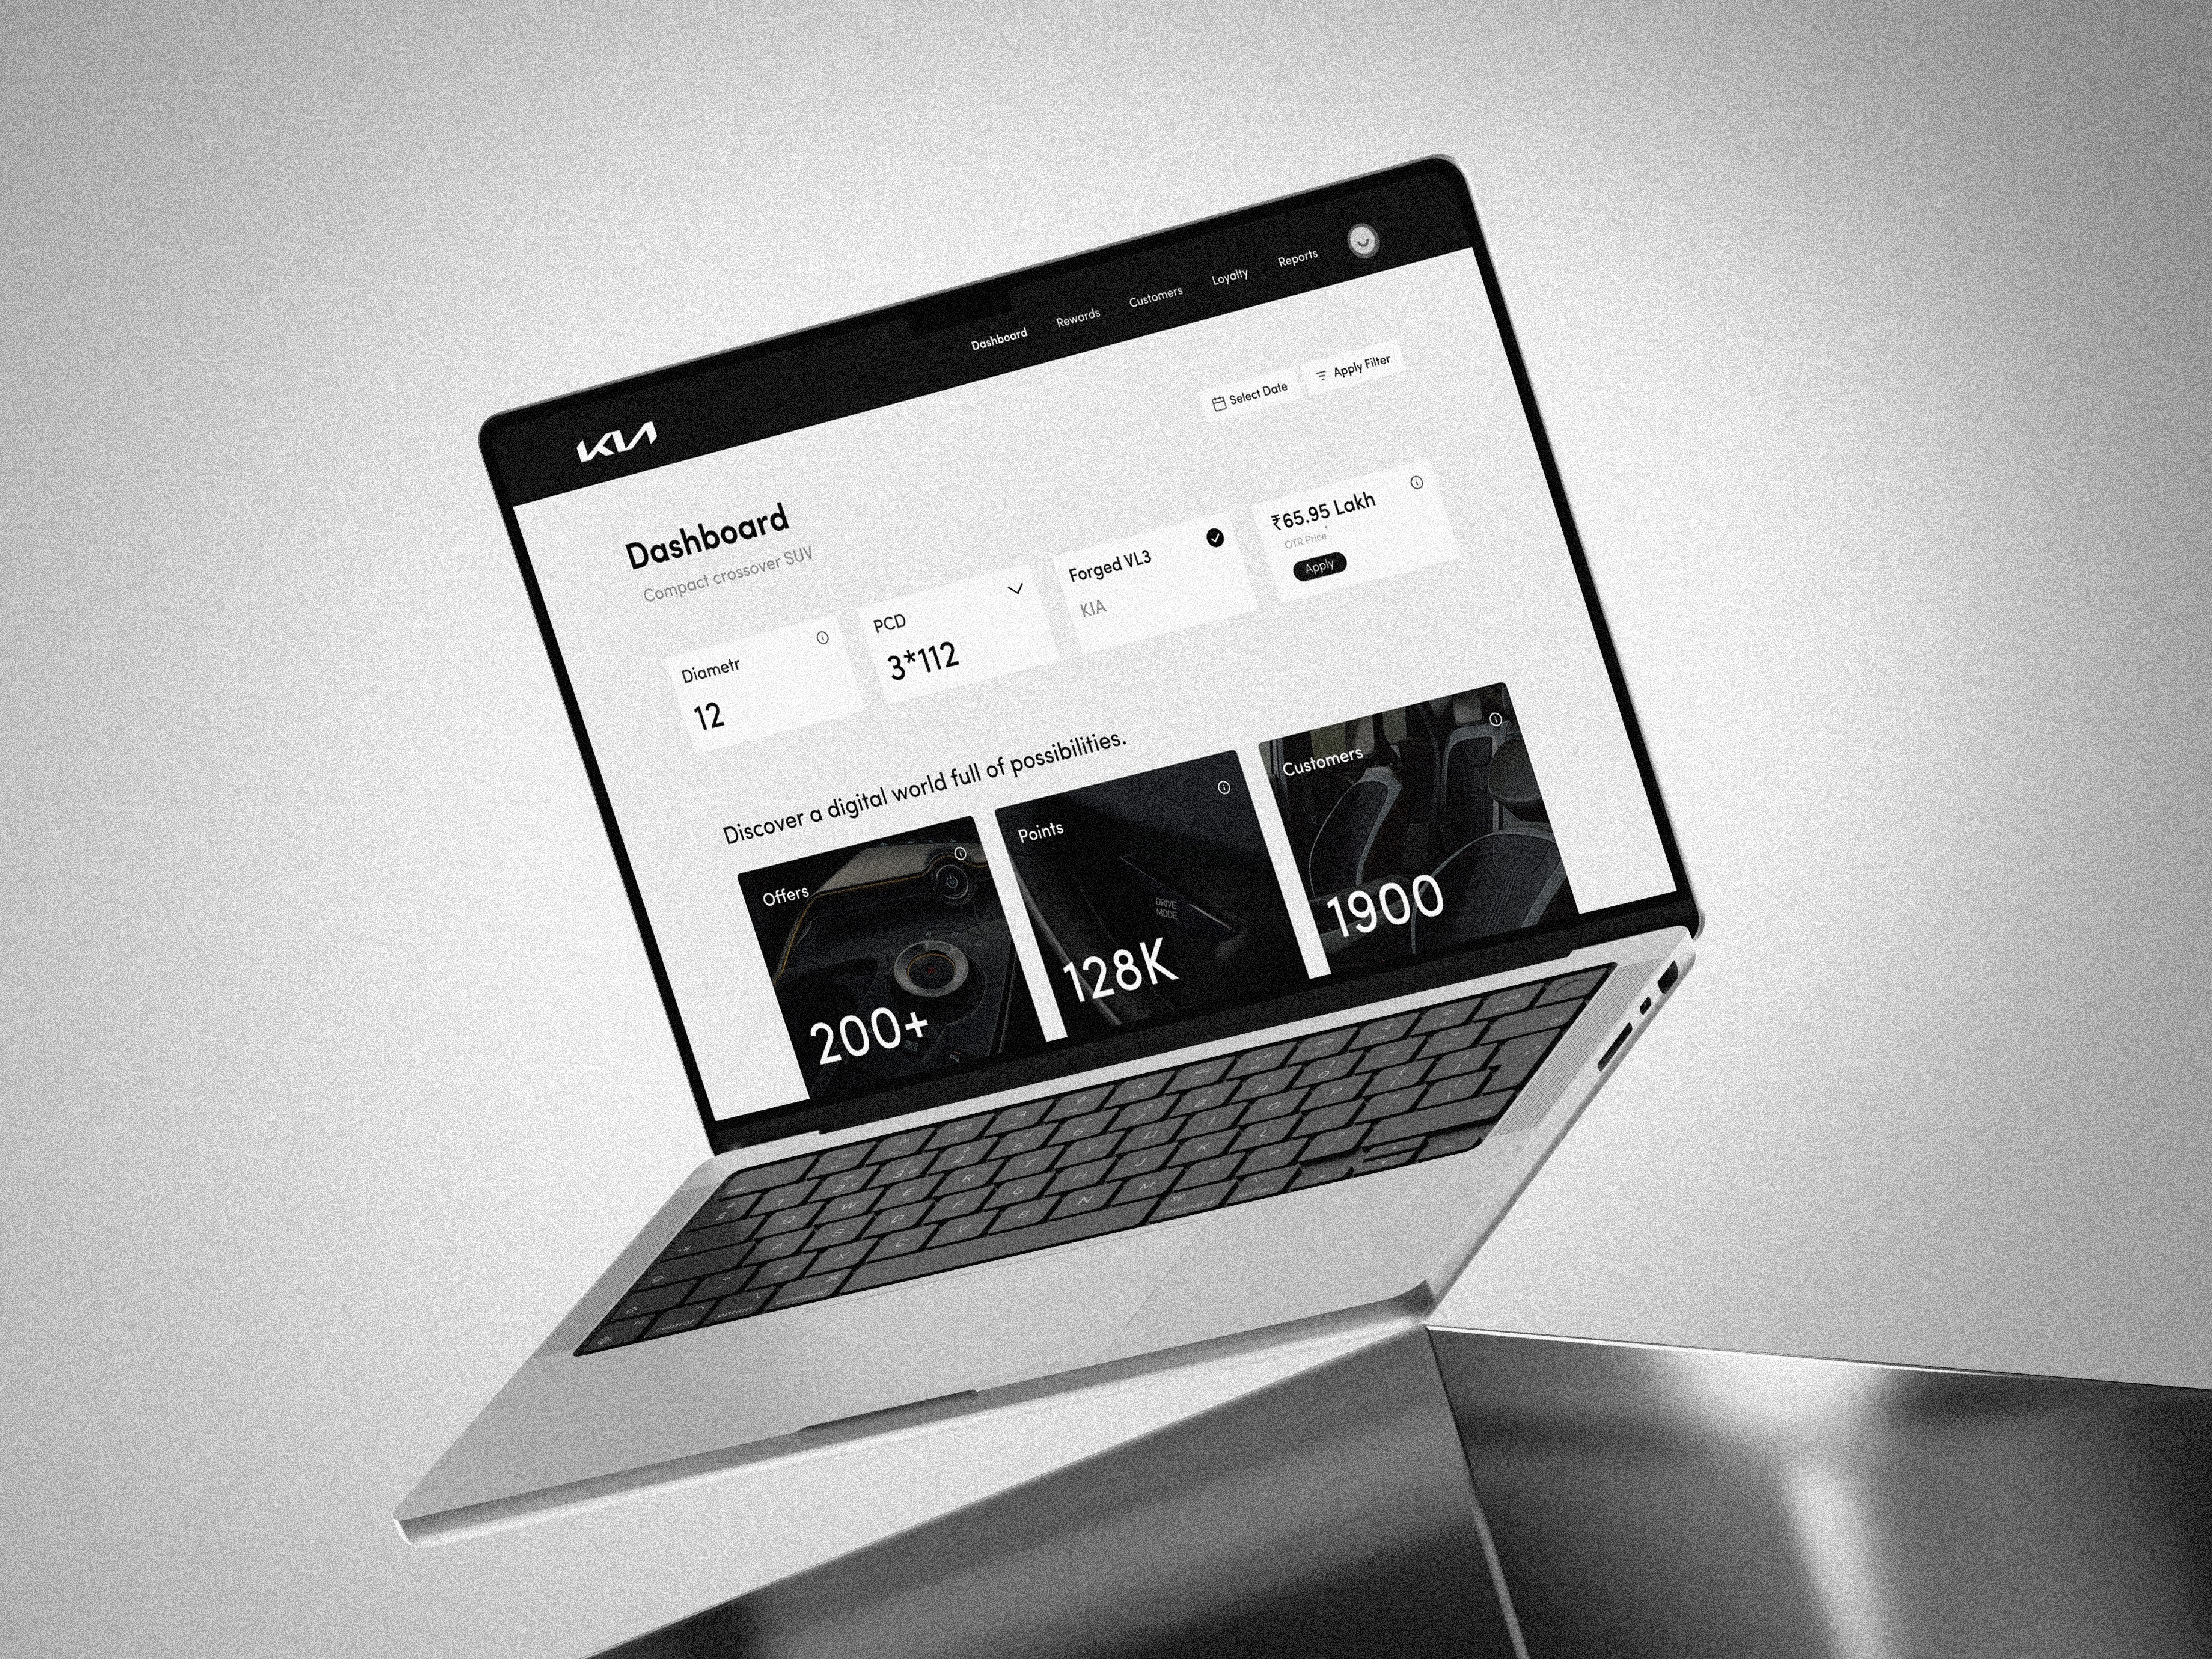
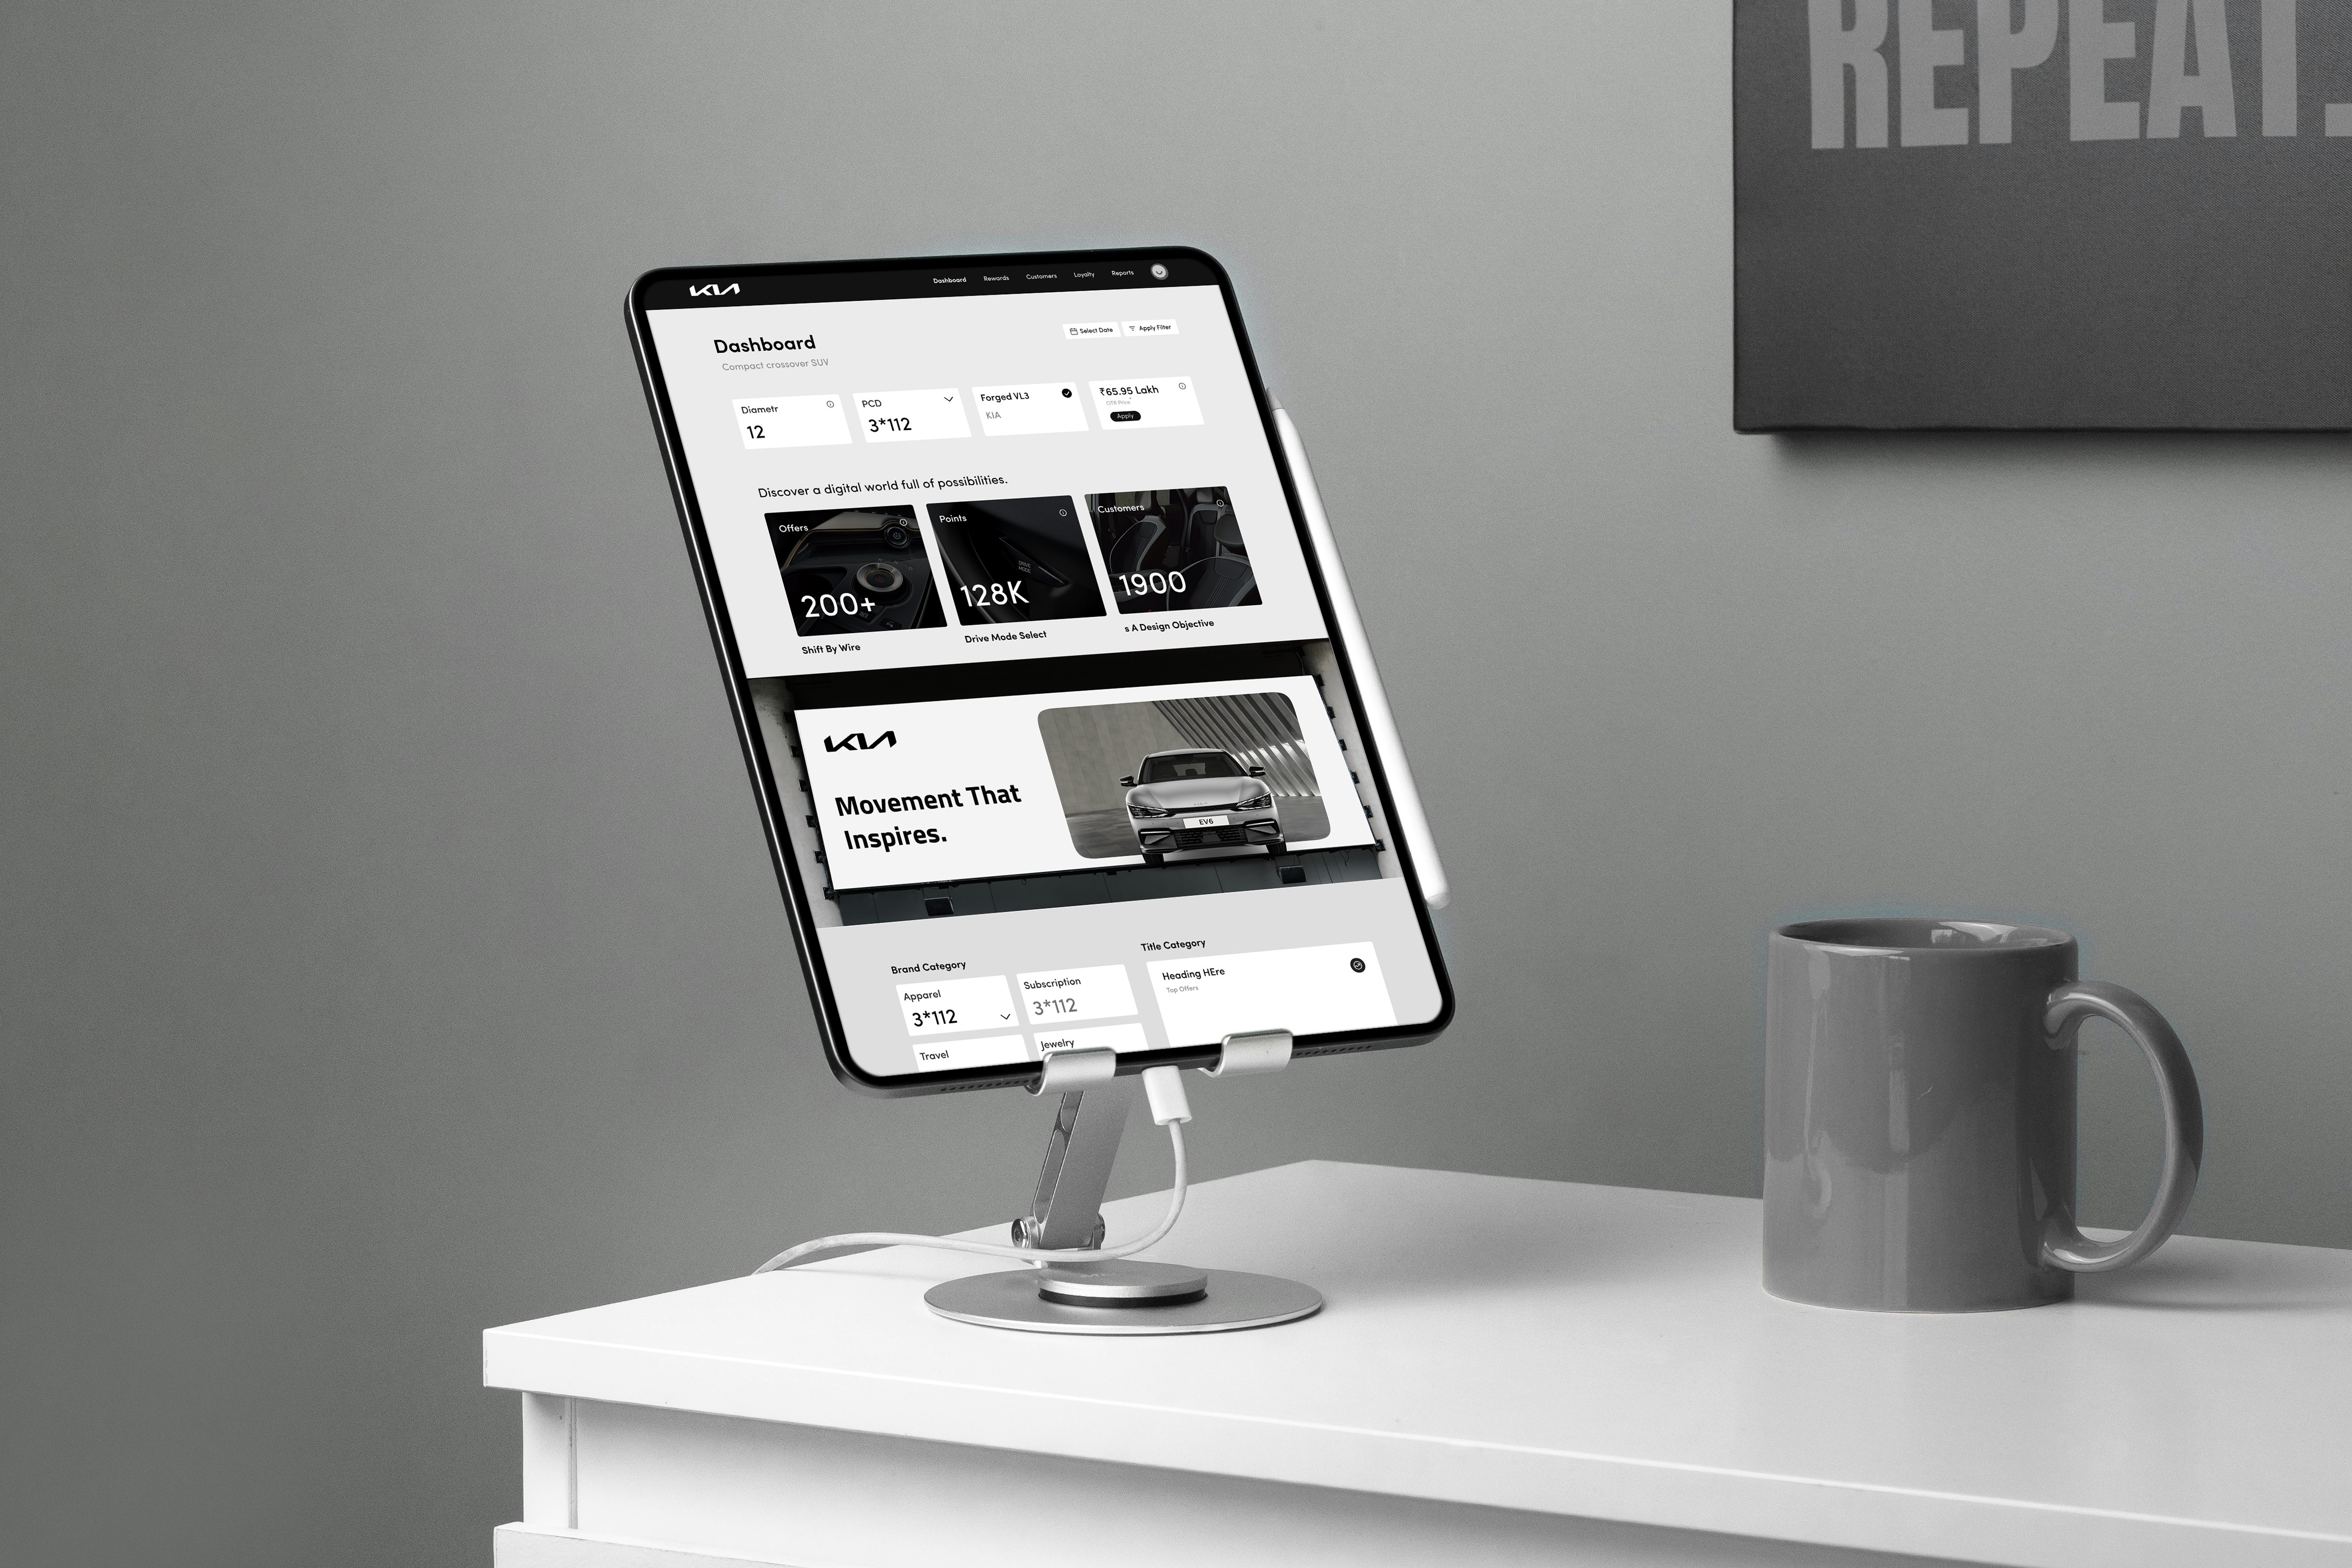
** For Kia, a prominent force in the global automotive landscape, the drive for sustained customer engagement and loyalty is paramount. To further solidify their position at the forefront of customer-centric innovation, Kia sought to engineer an intuitive and powerful loyalty dashboard. The objective was clear: to empower Kia with comprehensive, real-time insights into customer behavior, reward program efficacy, and the dynamic flow of loyalty points. ### **
Styles
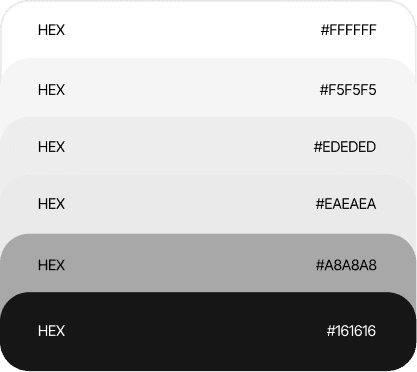
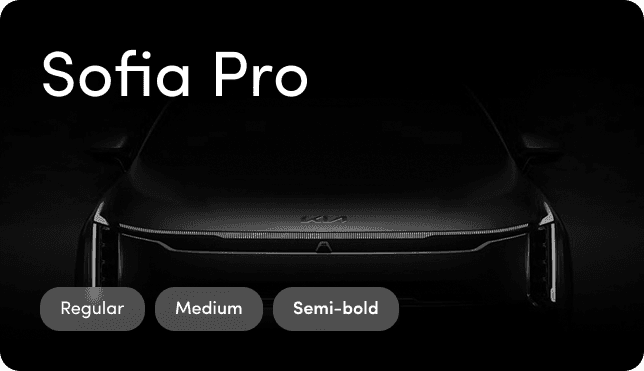
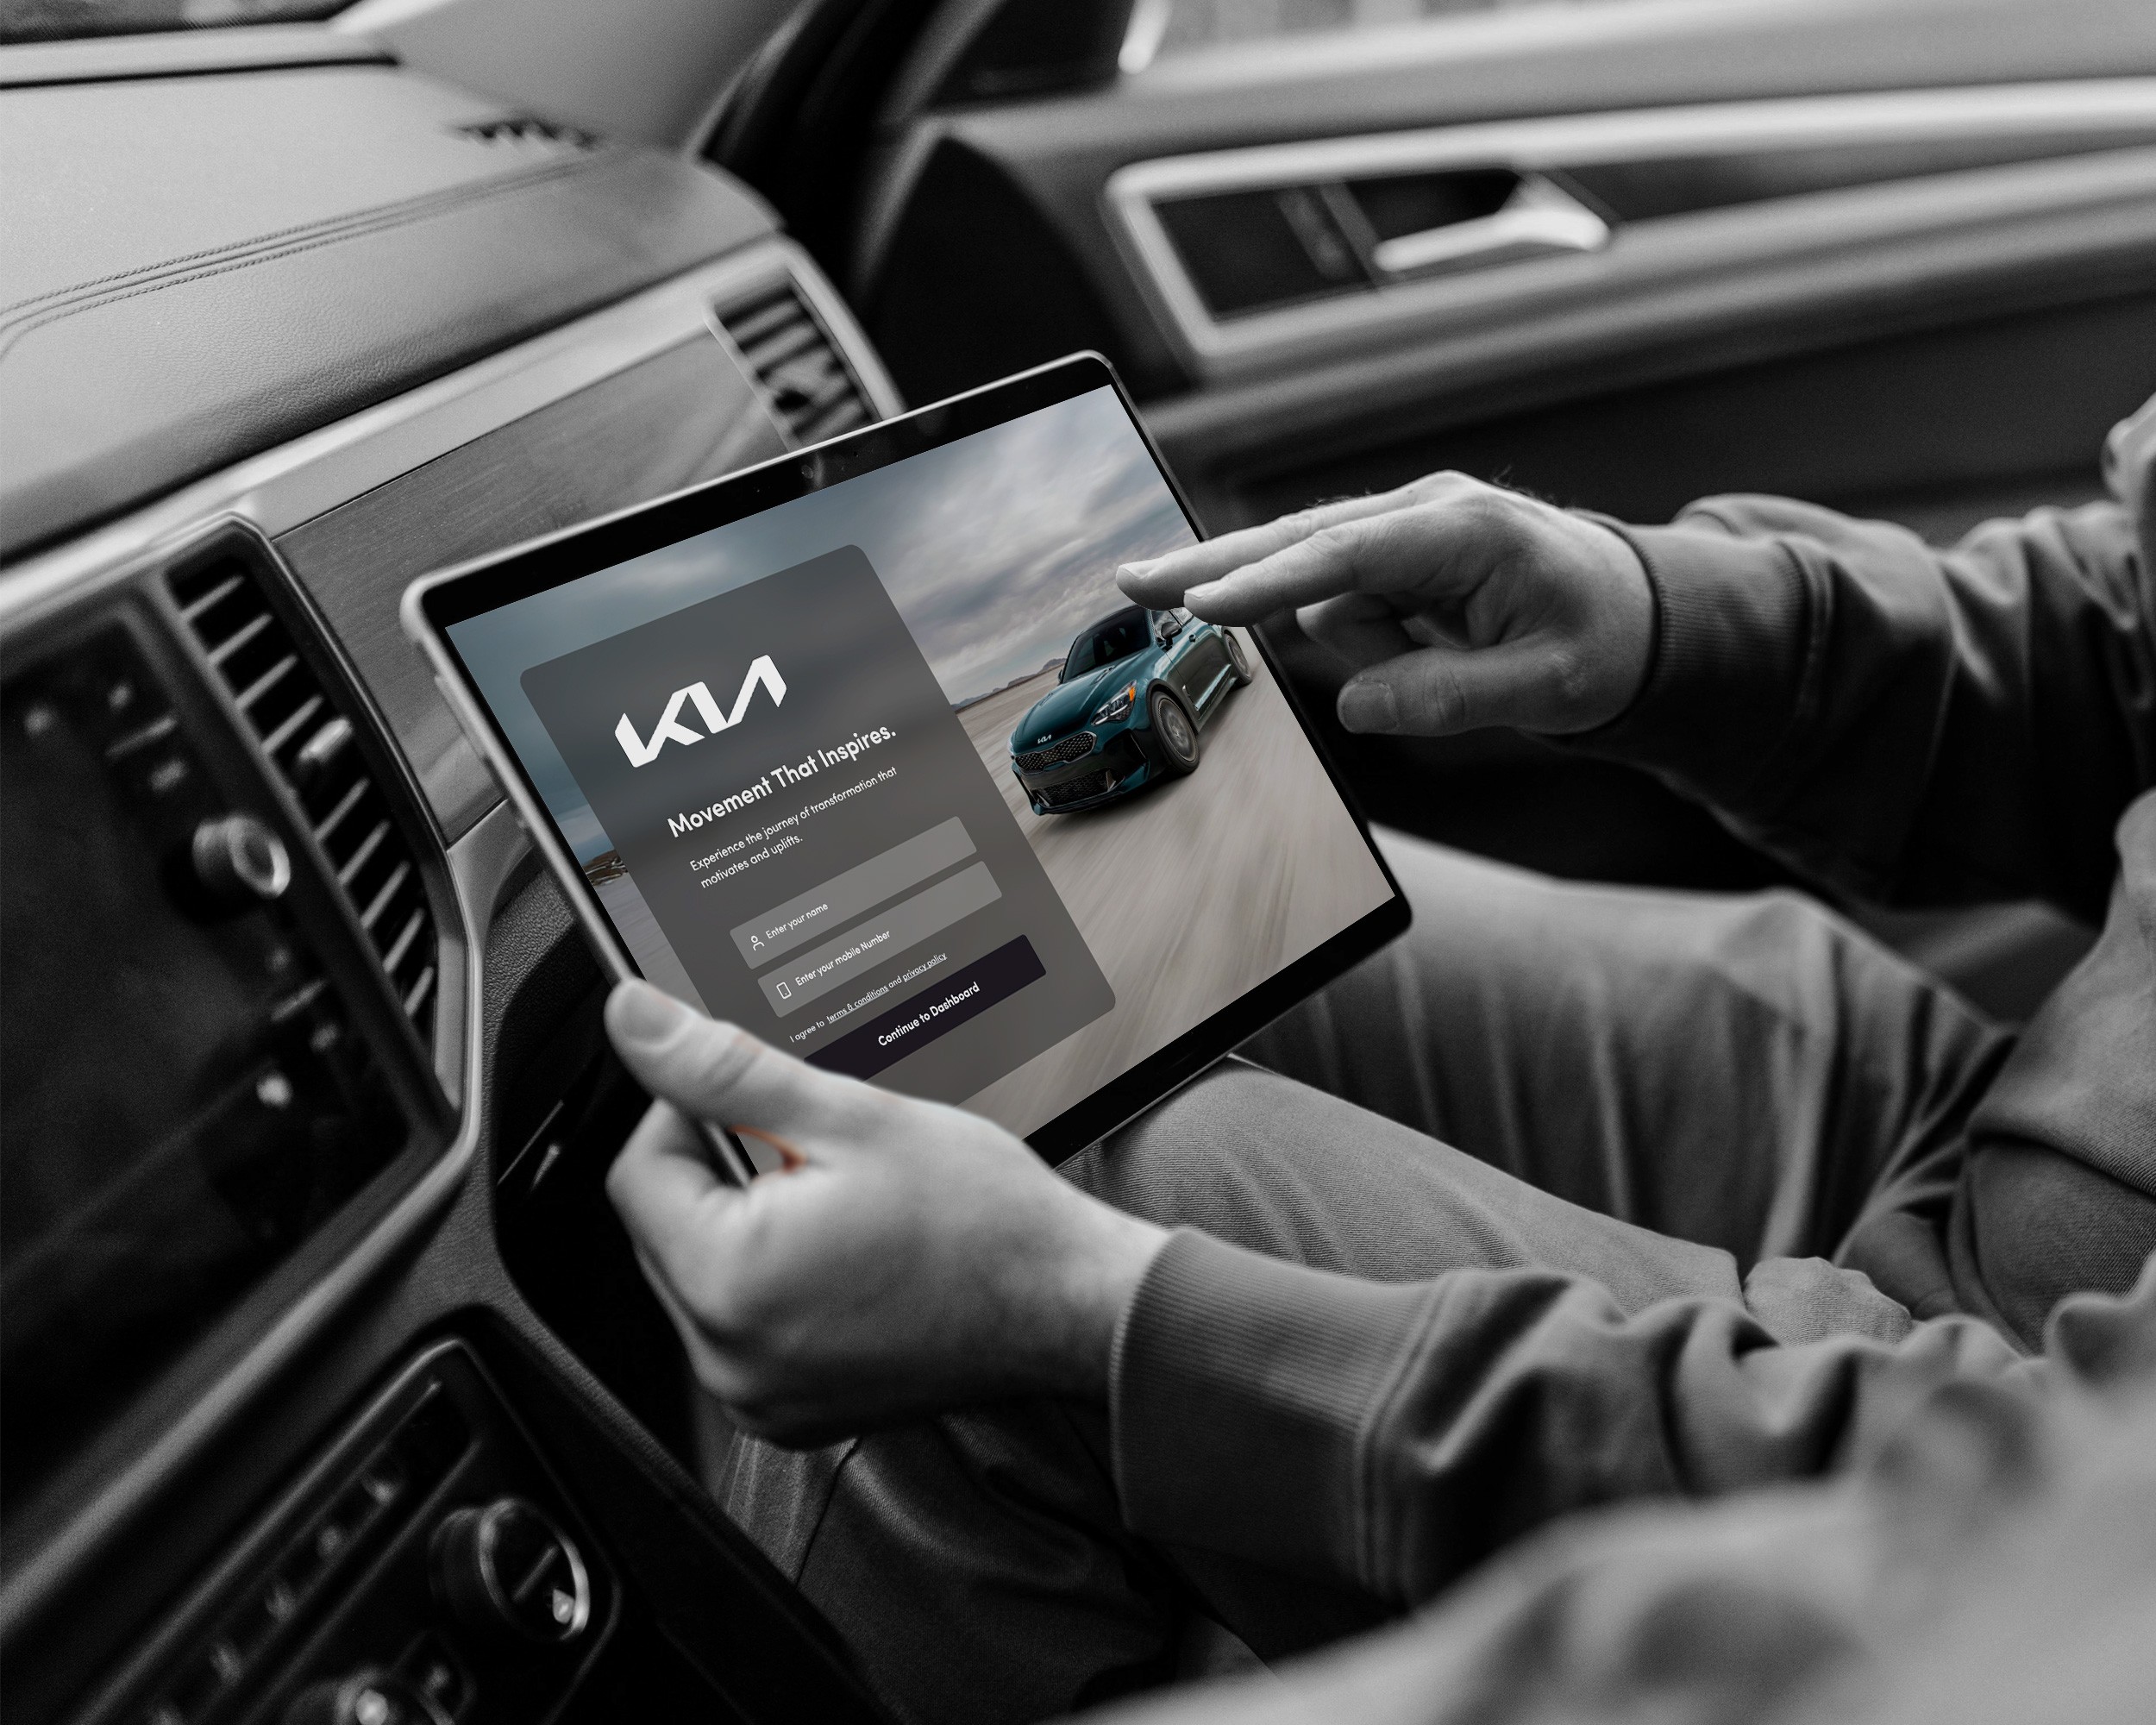
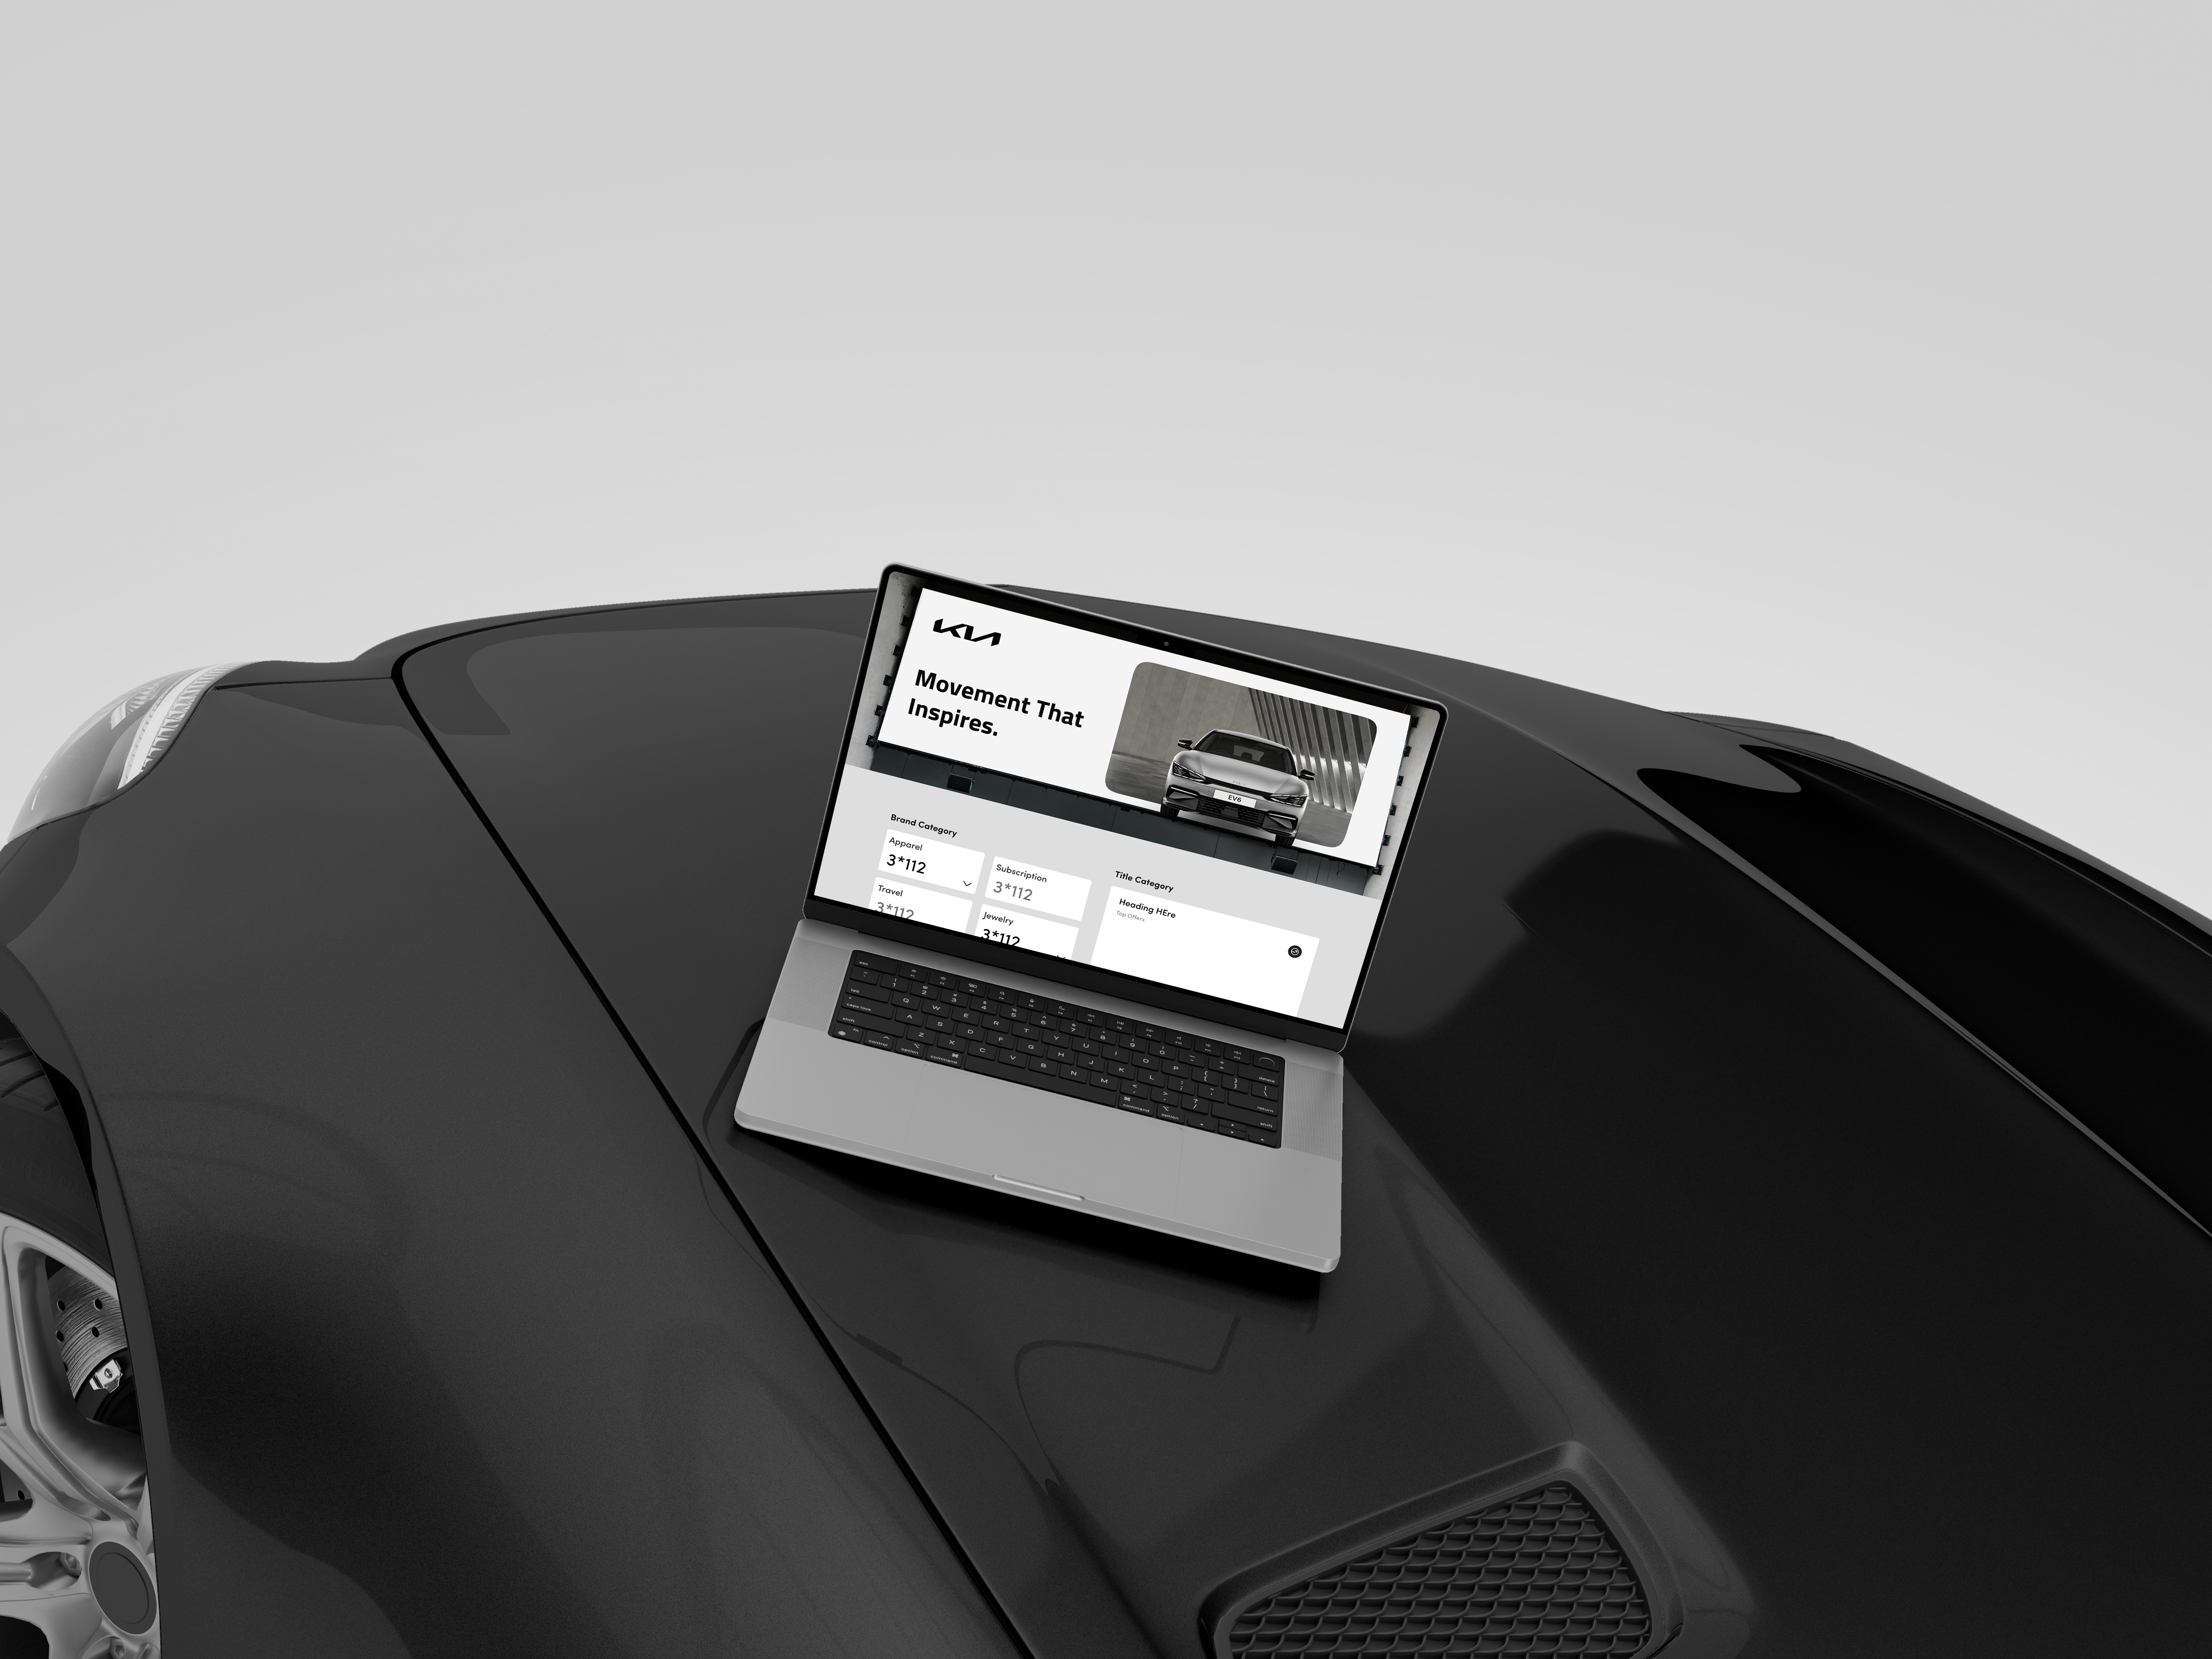
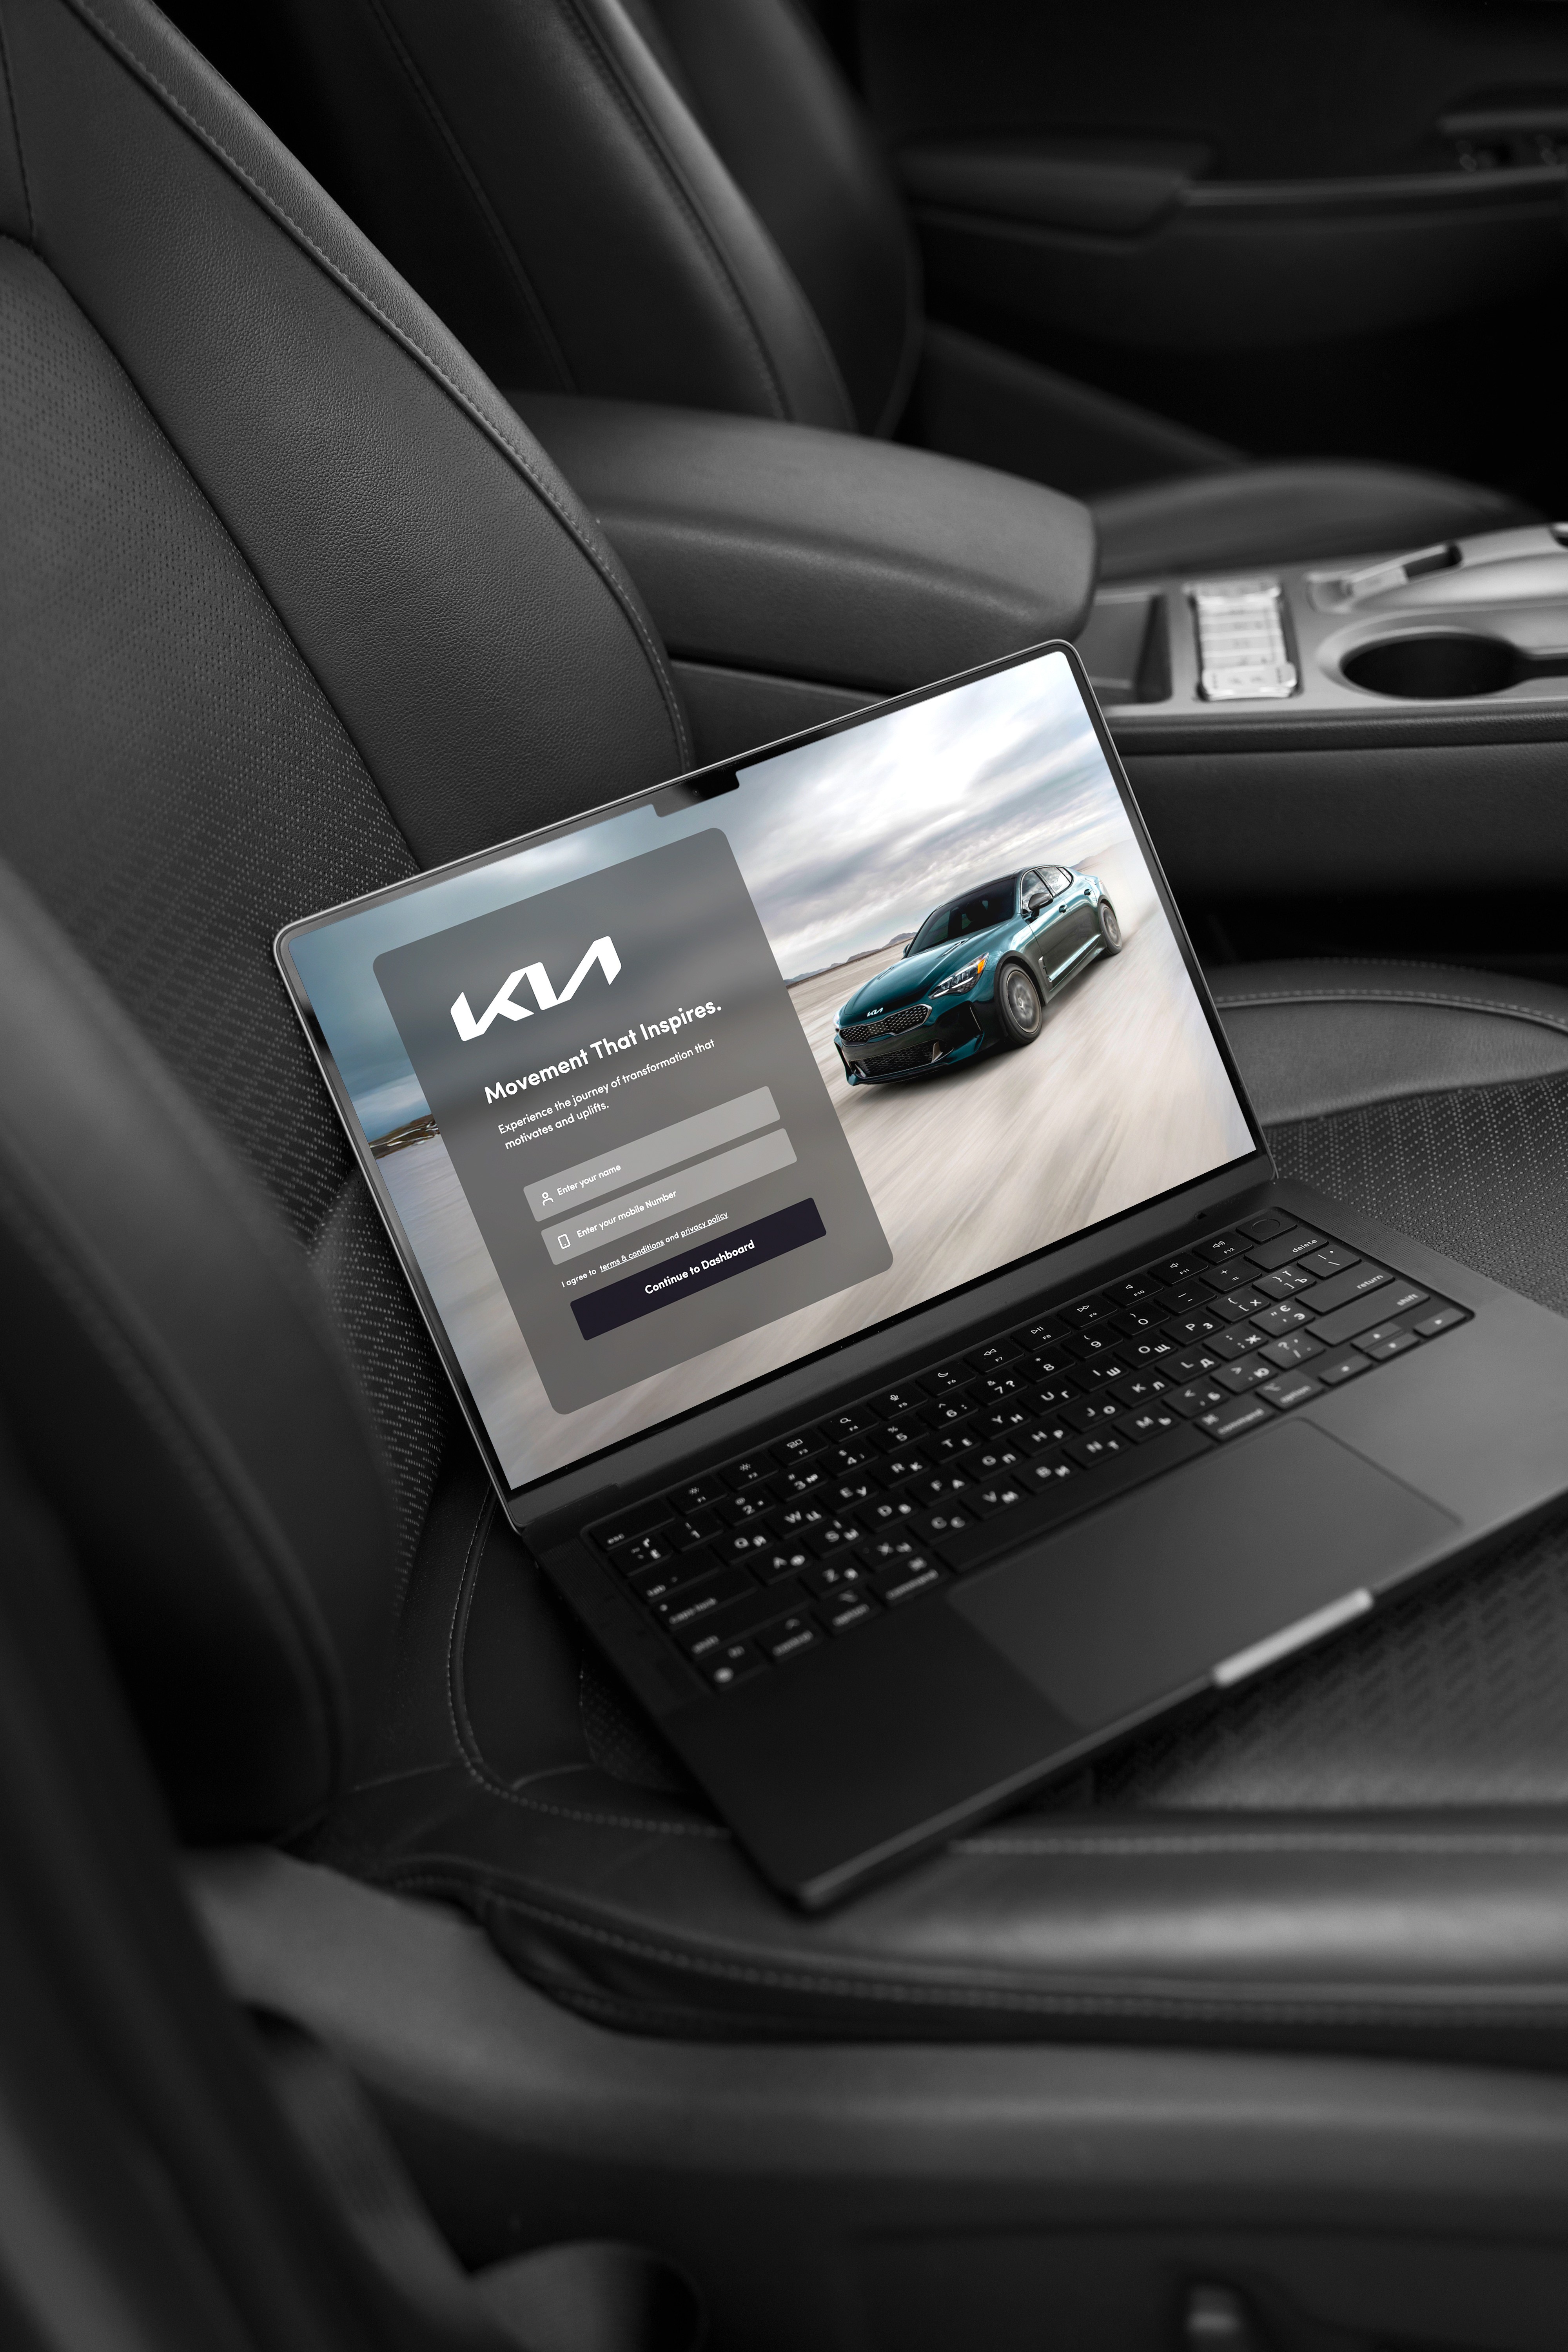
A cohesive style system that strengthens brand trust through consistent colour, typography, and imagery. The result: an elegant, approachable interface that communicates reliability and elevates user perception.
Challenges
** ## Challenges Kia needed rapid clarity across complex loyalty data: 1. Disparate Data Sources: Loyalty information was scattered across systems. 2. Insight Extraction: Raw data lacked actionable visualization. 3. Multi-Module Complexity: Dashboards required varied functional views. 4. Aggressive Timeline: Delivery was required within one week. --- ## **
Disparate Data Sources: Loyalty information was scattered across systems.
Insight Extraction: Raw data lacked actionable visualization.
Aggressive Timeline: Delivery was required within one week. --- ## **
Multi-Module Complexity: Dashboards required varied functional views.
Solutions
** A focused, high-
Focused Research Foundation
Rapid stakeholder and data analysis shaped the dashboard’s structure and relevance.
Strategic UX & Interaction Design
Intuitive flow across key pages ensured seamless navigation and faster insights.
Clean, Brand-Aligned UI
A modern interface clarified complex data and highlighted key performance metrics.
Insightful Dashboard & Rewards View
Visuals like redemption trends and top offers enabled quick program analysis.
Advanced Customer & Points Tracking
Granular data with smart filters (time, region, category) supported in-depth loyalty analysis.
CX-Driven & Agile Execution
Integrated customer experience insights with agile delivery for a responsive, scalable system.
Impact
dashboard was delivered through agile execution: 1. Rapid Stakeholder Research: Identified critical KPIs and data priorities. 2. Clear UX Architecture: Structured insights across dashboard, rewards, and reports. 3. Data-Driven UI Design: Presented complex metrics with clarity and speed. 4. Dynamic Performance Views: Visualized redemption trends and top offers. 5. Customer-Level Insights: Enabled filtering across time, region, and segments. 6. Agile CX Execution: Delivered a scalable system under extreme timelines. --- ## Impact The dashboard enabled faster decisions and loyalty optimization: 1. Accelerated Decision-Making: Real-time insights supported rapid action. 2. Improved Program Performance: Analytics enabled continuous optimization. 3. Deeper Customer Understanding: Granular data supported personalization. 4. Proof of Agile Delivery: One-week execution validated speed and quality. --- ## **
Rapid Stakeholder Research: Identified critical KPIs and data priorities.
Clear UX Architecture: Structured insights across dashboard, rewards, and reports.
Data-Driven UI Design: Presented complex metrics with clarity and speed.
Dynamic Performance Views: Visualized redemption trends and top offers.
Strategic Insights & Design Philosophy
Insight-First Design: Data value emerges through clarity. 2. Scalable Visualization Systems: Modular components support growth. 3. Cross-Team Collaboration: Integrated teams enable rapid outcomes. ## **


Scalable Visualization Systems: Modular components support growth.